


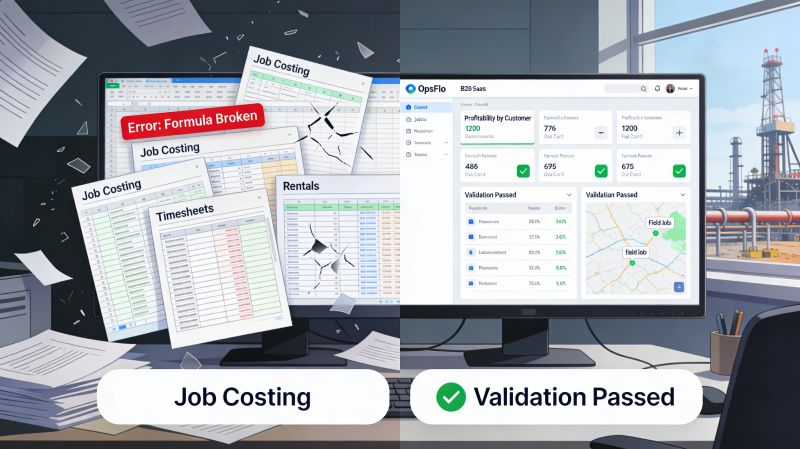
Analytics Dashboard Oilfield Operations Managers Check Every Morning
The hard truth: Every morning, your field crews generate thousands of data points. Pump pressures. Truck tickets. Fluid volumes. Downtime codes. The operator who reads that data fastest wins the contract. The operator who ignores it loses margin on every single ticket.
The modern analytics dashboard oilfield operations managers rely on is not a luxury. It is the difference between running a reactive trucking company and running a disciplined production machine. If you are still waiting for the Friday afternoon spreadsheet from the office manager, you are already three days behind the market. This guide shows you exactly what to check, what the numbers mean, and how to convert those insights into cash flow before your competitor even opens his laptop.
The Core Operational Breakdown: What You Are Actually Managing
You are not in the oil business. You are in the logistics and accountability business. The oil is already there. Your job is to move iron, fluids, and people to the right location at the right time, then prove you did it accurately enough to get paid in 30 days instead of 90.
An analytics dashboard oilfield operations manager checks every morning must answer five brutal questions. First, how much revenue did we generate yesterday versus what we forecasted? Second, how many hours of non-productive time (NPT) did we eat because a pump truck arrived late or a crew sat idle waiting on location? Third, what is our true cost per ticket, not just the average but the variance across crews? Fourth, how many tickets are sitting in approval queues at the operator's office? Fifth, which of our assets generated the most profit per hour, and which ones are bleeding us dry with maintenance costs?
Most operators can answer none of these questions before 10 AM. They can tell you what happened last month. They cannot tell you what happened yesterday. That delay is a silent killer. In the Permian Delaware basin, where a single frac spread can pump 40 stages a week, one hour of unplanned downtime on a wireline unit costs you roughly $1,200 in lost revenue plus the crew cost you pay anyway. Over a month, that is $30,000 gone because you did not see the trend coming.
The dashboard is your early warning system. It is not a report card. It is a radar screen. You are looking for blips that indicate a problem before it becomes a crisis.
The Real Financial Drain: Show Me the Math
Let me give you concrete arithmetic that keeps owners awake at night. Take a mid-sized oilfield service company running 12 vacuum trucks, 4 swab rigs, and 2 wireline units in the Midland basin. Average ticket value across all services is $4,800. You generate roughly 16 tickets per day. That is $76,800 in gross daily revenue.
Now apply the industry standard for ticket approval friction. Without a real-time analytics dashboard oilfield operations teams often see 35 percent of tickets rejected or kicked back for corrections on the first submission. Common reasons include mismatched PO numbers, incorrect pump start times, or a signature missing from the company man. Each rejection adds an average of 6 days to your billing cycle.
The DSO calculation: If you bill $2.3 million per month and your Days Sales Outstanding (DSO) sits at 55 days, you are carrying $4.2 million in unpaid work. Cut DSO by 15 days through faster, cleaner ticket approval, and you free up $1.15 million in working capital. At a 10 percent cost of capital, that is $115,000 in pure annual savings. That money does not come from working harder. It comes from seeing the bottleneck in your dashboard and fixing it.
Then there is the NPT bleed. A dispatcher using a manual whiteboard in the Haynesville sends a frac tanker to the wrong pad. The truck drives 45 miles round trip wasted. At $2.10 per mile operating cost for a heavy truck, that mistake costs $94.50 plus 2 hours of driver time. Now multiply that by 10 trucks making similar errors per week. That is nearly $1,000 per week in pure waste. The analytics dashboard oilfield operations supervisors use will flag that route deviation in real time and prevent the second occurrence.
Why Generic Solutions and Spreadsheets Fail in the Field
I have walked into dozens of field offices in the Bakken and Eagle Ford where the "analytics system" is a yellow legal pad and a whiteboard with grease markers. The office manager spends four hours every Monday transcribing handwritten tickets into QuickBooks. By Wednesday, she has a rough total. By Friday, the owner sees a number. That number is already stale.
Spreadsheets fail because they are static. They require manual entry, and manual entry introduces errors. A pumper writes "12" for the tank gauge but means "21". The wireline operator logs a 2-hour standby but forgets to select the correct code. These errors compound. By the time you see the variance, you cannot trace it back to the source.
Generic business intelligence tools like Power BI or Tableau fail for a different reason. They are excellent at displaying data but terrible at collecting it from the field. They do not understand PIDX format. They do not know that a "ticket" in the oilfield has a specific structure with specific required fields for the operator's revenue accounting system. They do not integrate with OpenInvoice or Cortex approval workflows. You end up building a custom data pipeline that costs $50,000 and requires a full-time developer to maintain.
What you need is a purpose-built analytics dashboard for oilfield operations that speaks the language of the field. It must ingest data from digital field ticketing automatically, normalize it, and present it in terms you understand: revenue per ticket, cost per mile, hours per job, and days in approval.
Step-by-Step Operational Framework: The Morning Routine
Here is the exact framework that top-performing operations managers use when they open their analytics dashboard oilfield operations system at 6 AM. Follow this sequence daily and you will catch problems before they cost you money.
Step 1: Verify Yesterday's Revenue Capture
Look at the total billed amount for the previous 24 hours. Compare it against your forecast. If you expected $76,800 and you see $61,000, you have a gap. The dashboard should show you which jobs are missing tickets. Did a crew finish at 2 AM and forget to submit? Did a ticket get rejected immediately? Do not move on to any other metric until you have accounted for every dollar of work performed.
Step 2: Check the NPT and Standby Report
Sort your jobs by non-productive time. Look for the highest total hours. A single job with 8 hours of standby is a red flag. Was it waiting on location? Waiting on the operator's pump schedule? The dashboard should categorize the reason. If you see a pattern of "waiting on location" for the same crew, your dispatch is booking jobs too tightly. If you see "waiting on operator," that is a contract issue you need to escalate with the company man.
Step 3: Review the Approval Queue Aging
Go to the ticket aging report. How many tickets are sitting in the operator's approval portal for more than 5 days? In the Permian, the standard is 48 to 72 hours. If tickets are stuck, the dashboard should show you who is holding them up. Sometimes it is the operator's field foreman who is too busy to click approve. Sometimes it is your own office that submitted an incomplete ticket. Either way, you need to know the name and the date.
Step 4: Analyze Asset Profitability per Hour
Look at each asset class. Your triplex mud pump on Job A generated $850 per operating hour. The same model pump on Job B generated only $420 per hour because of excessive downtime and slow rig-up. The dashboard should normalize this for you. Then you can have an honest conversation with the crew on Job B about their rig-up procedure.
Step 5: Monitor the Cost per Ticket Variance
This is the metric most owners ignore. Your average cost per ticket is $3,200. But Crew 1 in the Delaware runs at $2,900 while Crew 2 in the Midland runs at $3,800. Why the 30 percent difference? Look at fuel consumption. Look at overtime hours. Look at equipment maintenance. The analytics dashboard oilfield operations managers use will flag Crew 2 for review. You might find they are taking longer routes or not shutting down equipment during idle periods.
Permian Field Case Study: Exact Metrics That Matter
Consider a real scenario from a pressure pumping logistics provider in the Permian Delaware basin. This company runs 18 frac sand haulers and 4 vacuum trucks supporting two completion crews. They switched from manual dispatch to a digital ticketing and analytics system. Here is what they found in the first 30 days.
The analytics dashboard oilfield operations module revealed that 22 percent of all tickets had at least one line item error. The most common error was incorrect tare weight on the sand haulers. A driver would enter the empty weight incorrectly by 200 pounds. Over a 40,000 pound load, that is a 0.5 percent error. It does not sound like much. But when the operator's scale house caught the discrepancy, they rejected the entire ticket. That rejection added 11 days to the payment cycle.
By fixing the tare weight entry process with a digital pre-population feature, they reduced ticket rejections from 22 percent to 4 percent in three weeks. Their DSO dropped from 58 days to 41 days. That 17-day improvement on $1.8 million in monthly billings freed up $1.02 million in cash. They used that cash to prepay their fuel supplier for a 4 percent discount, saving another $6,500 per month.
NPT reduction in the same period: The system flagged that one specific vacuum truck crew was logging an average of 3.2 hours of standby per day. Investigation showed the truck was being dispatched to location 45 minutes before the crew was ready to rig up. The dispatcher adjusted the departure times. Standby hours dropped to 1.1 per day. At an internal cost of $95 per hour for that truck, the savings were $199 per day, or $5,970 per month, for just one asset.
The total measurable benefit in the first quarter was $138,000 in freed cash flow and avoided costs. That is not a rounding error. That is the difference between a profitable quarter and a break-even one.
Implementation Checklist for Supervisors and Office Dispatch
You cannot just buy a dashboard and expect results. You must implement it with discipline. Here is the checklist I give every operations manager I advise.
- Day 1 to 7: Stop all manual ticket entry. Move every field crew to digital field ticketing on tablets or phones. Do not allow exceptions. The old paper habit will kill your data quality.
- Day 8 to 14: Configure your analytics dashboard oilfield operations view. Set up the five core reports: daily revenue capture, NPT by crew, approval queue aging, asset profitability per hour, and cost per ticket variance. Share these reports with your dispatchers and field supervisors.
- Day 15 to 21: Hold a daily 15-minute standup meeting at 7 AM. Walk through the dashboard. Assign action items for every red flag. The company man does not need to be on this call. This is your internal operational review.
- Day 22 to 30: Review the data quality. Look for tickets that were rejected. Identify the root cause. If it is a training issue, fix it. If it is a system issue, escalate it to your software vendor.
- Day 31 onward: Start using the predictive features. Look at the trend lines for NPT and ticket rejections. If the trend is flat or rising, your implementation is failing. If it is declining, you are on track.
The critical element is the daily review. A dashboard that is checked once a week is just a pretty report. A dashboard that is checked every morning becomes the operating rhythm of your company.
Frequently Asked Questions
How long does it take to see a return on an analytics dashboard oilfield operations investment?
Most operators see a measurable return in 30 to 45 days. The first win is usually in ticket rejection reduction. When you fix the data entry errors that cause rejections, your cash flow improves immediately. The second win is in NPT reduction, which takes a bit longer because you need to change dispatch behavior. Run the numbers through our ROI calculator to see your specific payback period based on your ticket volume and current DSO.
Does this integrate with OpenInvoice or Cortex for operator approvals?
Yes. The system is built to generate tickets in the standard PIDX format that these operator portals expect. When your ticket is clean and complete, it flows through the approval process without manual intervention. The dashboard tracks the status of every ticket inside those portals so you know exactly where it sits in the queue.
What if my field crews are not tech savvy?
The interface is designed for a pumper who has been in the field for 30 years. It is not a complicated enterprise software system. It looks like a text message conversation. The driver selects the job, enters the numbers, takes a photo of the gauge if required, and hits send. Training takes less than 15 minutes per crew member. The biggest challenge is breaking the paper habit, not learning the software.
Can I see data for multiple basins or divisions in one view?
Yes. If you operate in the Permian and the Haynesville, you can filter by region, by crew, or by asset type. The executive view rolls up all divisions into a single P&L style summary. The field supervisor view drills down to the individual ticket level. Both views use the same underlying data, so there is no reconciliation needed between what the field sees and what the office sees.
Clear Executive Takeaway
The oilfield is a margin game. The operator who controls NPT, accelerates billing, and maximizes asset utilization wins. The operator who flies blind loses. It is that simple.
You do not need another spreadsheet. You do not need a generic BI tool that requires a data scientist to operate. You need a system that collects accurate data at the source, presents it in an analytics dashboard oilfield operations format that your dispatchers and supervisors understand, and connects directly to the billing cycle for faster payment.
Start with the morning review. Check your revenue capture. Check your NPT. Check your approval queue. Do this every single day for 30 days. You will find waste you did not know existed. You will find cash that was trapped in the system.
If you want a clear picture of your specific exposure, request a revenue diagnostic with our team. We will show you exactly where your money is leaking and what accelerated oilfield billing can do for your working capital. The data is there. The only question is whether you will look at it.
No comments yet
Be the first to share your thoughts.
Leave a Reply
Comments are disabled on the shared-hosting build. If you want to respond to this article, email info@ops-flo.com and mention "Analytics Dashboard Oilfield Operations Managers Check Every Morning".
Contact OpsFlo