

Equipment Failure Prevention Oilfield Teams Underinvest In
The Hard Truth: The average mid-sized oilfield service company loses $1.2 million per year to preventable equipment failures. Not because the iron is bad. Because the maintenance system is broken. This guide is about equipment failure prevention oilfield teams actually need, not the generic checklist your OEM handed you.
The Core Operational Breakdown: Why Your Iron Dies Before Its Time
You run triplex mud pumps in the Permian Delaware that should deliver 3,000 hours between overhauls. You are getting 1,800. Your frac manifolds in the Midland Basin are showing washouts at half their rated cycle life. Your wireline units in the Bakken are throwing spooling errors that cost you four hours of rig time per incident.
This is not a mechanical problem. It is an information problem. The vibration data was on the sensor. The pressure spike was in the PLC log. The fluid contamination was visible in the oil sample. But nobody saw it in time because your failure prevention system relies on a grease-stained clipboard and the memory of a night shift operator who quit last Tuesday.
Equipment failure prevention oilfield operations require a shift from reactive firefighting to predictive discipline. The operators who master this shift do not just save money. They win contracts. They keep company men happy because they do not blow the drilling window. They get first call on the next pad because their uptime is 97 percent while the competitor sits at 89 percent.
Let us be direct about what is failing. The top three causes of premature equipment death in the field are not exotic metallurgy failures. They are lubrication starvation, fluid contamination, and operator overstress. Each one is preventable. Each one is being ignored because the systems to catch them are manual, slow, and disconnected from the people who can act.
The Real Financial Drain: Show Me the Math
Executives talk about uptime percentages. Field supervisors talk about dollars per hour of non-productive time (NPT). Let us talk in the only language that matters: cash.
Consider a single frac pump failure in the Haynesville. The pump goes down at 10:00 AM. The crew stops pumping. The company man is on location with a 24-hour spread rate of $180,000 per day. That is $7,500 per hour of idle iron.
The failure was a cracked fluid end. It was preventable. The pressure data showed a growing anomaly for three days. Nobody reviewed it. The repair takes 14 hours because the replacement part is in Odessa and you are in Marshall, Texas. That one failure costs you $105,000 in spread rate penalties, plus $48,000 for the part and the service crew overtime. Total: $153,000 for one event.
Now multiply that by the 28 failures your fleet experienced last year. That is $4.28 million in direct costs. That is the number one operator in your basin saved by implementing a real equipment failure prevention oilfield protocol. They did not buy new pumps. They bought better information flow.
The NPT Calculation: If your fleet runs 12 frac pumps and each one suffers one avoidable 10-hour failure per quarter, you lose 480 hours per year. At a blended spread rate of $4,200 per hour, that is $2.016 million in lost revenue. A 50 percent reduction in failure frequency adds $1 million to your bottom line without adding a single new asset.
Do not forget the secondary damage. A failed swab rig in the Eagle Ford does not just stop that job. It forces you to cancel the next job. You lose the day rate on well number one and the mobilization fee on well number two. Your dispatcher spends six hours calling around for a replacement unit. Your customer starts calling your competitor. The true cost of one failure is often three times the repair invoice.
Why Generic Solutions and Spreadsheets Fail in the Field
I have walked into dozens of oilfield offices and seen the same scene. A desktop computer running an Excel spreadsheet with a list of equipment. A column for "last service date." A column for "hours." A column for "notes." It looks organized. It is a lie.
The spreadsheet fails because it is static. Your equipment is dynamic. A triplex pump running at 120 SPM in the Delaware heat behaves differently than the same pump running at 90 SPM in a North Dakota winter. The spreadsheet does not know the difference. It just knows the date.
The spreadsheet fails because it is disconnected. The pumper in the field sees the high-temperature alarm at 2:00 AM. He writes it in his log. He tells the day operator when he gets back to the yard. The day operator types it into the spreadsheet on Thursday. By then, the bearing has already spalled. The failure happened on Saturday. You are down for 36 hours.
Generic CMMS software fails for a different reason. It was designed for a factory with stationary machines bolted to a concrete floor. Your equipment moves every three days. Your operators are not sitting at a terminal. They are standing in the mud with a radio in one hand and a grease gun in the other. If the system requires them to log into a laptop to report a fault, they will not do it. The friction is too high.
The most dangerous failure mode is the silent one. The equipment does not stop. It just degrades. The vacuum truck loses 5 percent of its vacuum efficiency. The top drive shows a slight increase in torque ripple. The separator is carrying a little more water than it should. Each one is minor. Each one is invisible. Each one is eating your margin by 2 percent per month. By the time you notice, the pump is seized or the gearbox is scrap.
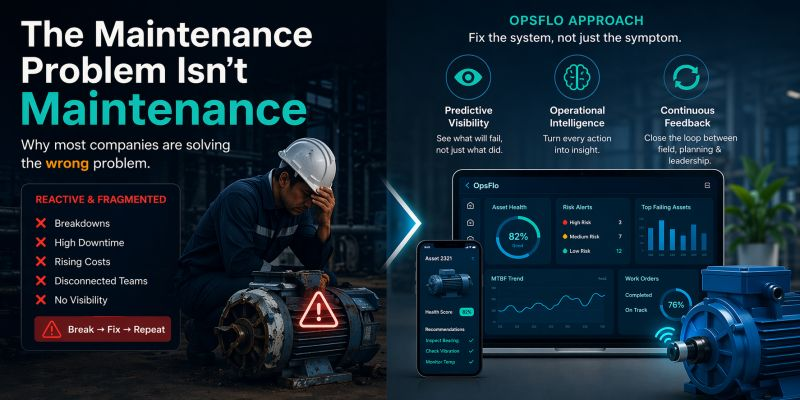
Equipment failure prevention oilfield strategy requires a system that lives where the work happens. It must be mobile. It must be simple. It must connect the sensor reading in the field to the dispatcher in the office and the invoice in accounting. When that connection is real, you stop failures before they start.
The Step-by-Step Operational Framework for Failure Prevention
You need a framework that works in the Permian, the Bakken, and the Haynesville. You need something that works whether you have 5 assets or 500. Here is the framework that the best-run service companies use. It has four stages.
Stage One: Standardize the Data Capture Point
Stop relying on memory. Every piece of iron gets a digital identity. That identity travels with the asset. It includes the manufacturer, the model, the serial number, the hours, the last service date, and the service history. When the asset moves from the Midland yard to a job in Carlsbad, the identity moves with it.
The operator on location captures data at the point of work. Not in the office later. Not on a scrap of paper. On a mobile device that works offline because the Permian has dead zones. The data is structured. It is not a free-text note that nobody can read. It is a specific reading: oil pressure, temperature, vibration, hours, fluid level.
This is where most companies fail. They skip the standardization and go straight to buying sensors. Sensors without a standardized capture process generate noise, not signal. You end up with 10,000 data points and zero actionable insight.
Stage Two: Automate the Alerting and Escalation
A reading that stays in the field is a reading that does not matter. The system must compare the reading against the expected range for that asset, that operating condition, and that environment. When the reading is out of range, the system alerts the right person.
The alert goes to the field supervisor first. If the supervisor does not acknowledge within 30 minutes, it escalates to the operations manager. If the operations manager does not act within two hours, it escalates to the VP of Operations. This is not about micromanaging. It is about ensuring that a $300,000 pump does not die because a $30 bearing warning was ignored.
The alert must include context. Not just "High Temperature." But "Pump 4, Unit 12, Temperature 210F, expected max 185F, running at 110 SPM, last service 412 hours ago. Recommended action: reduce load and inspect cooling system." The operator knows what to do immediately. He does not have to call the office and wait for an engineer to interpret the data.
Stage Three: Close the Loop with Maintenance and Parts
The alert triggers a work order. The work order specifies the required part. The system checks inventory. If the part is not in stock, it generates a purchase request automatically. The part is ordered before the equipment fails, not after.
This is the difference between preventive maintenance and predictive maintenance. Preventive maintenance changes the oil every 500 hours regardless of condition. Predictive maintenance changes the oil when the contamination sensor says the oil is degraded. You save money on oil and you save money on the engine that would have failed if you waited the full interval.
The maintenance history is recorded digitally. The next time that asset is scheduled for work, the dispatcher sees the full picture. He knows that Unit 7 has a history of cooling issues. He assigns it to a summer job in the Permian, not a winter job in the Bakken where a cooling problem is less likely to be fatal.
Stage Four: Analyze the Fleet, Not Just the Asset
The real gold is in the aggregate. When you have six months of standardized data across 50 assets, you start to see patterns. You see that the triplex pumps manufactured in 2019 have a higher failure rate in the first 200 hours after a major overhaul. You see that the wireline units with a specific brand of spooling motor fail twice as often as the others.
This analysis tells you what to buy next. It tells you which OEM to trust. It tells you which of your maintenance techs has a higher rework rate. It tells you which basins are harder on specific equipment types.
A robust predictive maintenance platform for oilfield assets handles this analysis automatically. It flags the anomaly before it becomes a failure. It gives your team the time to act while the problem is still cheap to fix.
Permian Case Study: How One Operator Prevented $4.2 Million in Failures
Let me show you the exact numbers from a pressure pumping operator running 14 frac spreads across the Permian Delaware and Midland basins. They were a solid operator. Good equipment. Experienced crews. But they were bleeding cash on unplanned maintenance.
In the 12 months before they changed their approach, they recorded 47 unplanned equipment failures. The breakdown was stark. Twenty-one failures were in the fluid ends of their triplex pumps. Eleven were in their blender transmissions. Nine were in their frac manifolds. Six were in their wireline units.
The average cost per failure was $89,000 when they accounted for parts, labor, spread rate penalties, and lost future revenue. That is $4.18 million in total losses for the year. Their uptime across the fleet was 91.3 percent. That sounds decent until you realize their best competitor was running at 96.8 percent.
They implemented a structured equipment failure prevention oilfield program. They did not buy a single new pump. They did not hire a single new engineer. They changed their data flow.
Every operator on every spread was required to log a daily equipment health check on a mobile app. The check took four minutes. It captured 12 key readings per asset. The readings were compared against the asset-specific baseline. Any reading outside the normal range triggered an alert to the spread supervisor and the central dispatch.
The results came in over the next 12 months. Total failures dropped from 47 to 19. That is a 60 percent reduction. The failures that did occur were less severe because they were caught earlier. Average cost per failure dropped from $89,000 to $41,000. Total failure cost dropped from $4.18 million to $779,000.
The savings were $3.4 million in direct failure costs. But the bigger win was on the revenue side. Their uptime climbed to 96.1 percent. That 4.8 point improvement meant they could take on more work. They added two new frac spreads without buying any new pumps. They simply had the reliability to commit to more jobs.
The total financial impact was $4.2 million in prevented failures and recovered revenue. That is not a theoretical number. That is the actual result from changing the way field data moves.
Implementation Checklist for Supervisors and Office Dispatch
You do not need a six-month consulting engagement to start. You need a clear checklist and the discipline to follow it. Here is the implementation plan that works.
- Inventory your critical assets. List every pump, top drive, wireline unit, vacuum truck, and frac manifold that is revenue-generating. Assign a unique identifier to each one. Do not skip the small stuff. A failed 2-inch valve on a manifold costs the same spread rate as a failed pump.
- Define the baseline for each asset. What is the normal operating temperature? What is the normal vibration range? What is the normal pressure? Write it down. Make it specific to the asset, not the model. Two pumps from the same manufacturer can have different baselines due to wear and history.
- Choose your data capture method. It must be mobile. It must work offline. It must take less than five minutes per asset per day. If it takes longer, your operators will skip it. If they skip it, you have no data and you are back to the spreadsheet.
- Set your alert thresholds. Start with the OEM recommendations. Then adjust based on your field experience. If you are getting too many false alarms, raise the threshold. If you are missing failures, lower it. The goal is to catch the problem when it is 10 percent developed, not 90 percent.
- Define the escalation path. Who gets the alert first? Who is the backup? What is the response time expectation? Write it down. Post it in the dispatch office. Make sure every operator knows the chain.
- Connect the alert to the work order. The alert is not the end of the process. It is the beginning. The work order must be created automatically. The parts must be checked. The maintenance tech must be assigned. If the alert does not trigger action, it is just noise.
- Review the data weekly. The operations manager reviews the failure alerts and the maintenance actions every Monday morning. The review is not optional. It is the mechanism that catches the systemic issues before they become catastrophic.
- Track your NPT and failure cost monthly. You cannot improve what you do not measure. Track the number of failures, the hours of NPT, and the total cost. Compare it month over month. The trend is your report card.
Office dispatch plays a critical role. The dispatcher is the one who sees the full picture of asset availability. When the system flags an asset as high risk, the dispatcher must factor that into the job assignment. Do not send a high-risk pump to a critical job that cannot tolerate downtime. Send it to a lower-risk job or keep it in the yard for maintenance.
The dispatcher also controls the parts inventory. When the system generates a parts request, the dispatcher approves it the same day. Not next week. The part needs to be in the yard before the equipment fails, not after. A 24-hour delay in ordering a $2,000 bearing can cost you $150,000 in downtime.
Your digital field ticketing system should feed into this maintenance workflow. The ticket tells you which assets were used on which job. The maintenance system tells you the condition of those assets. When you combine the two, you know which jobs are hardest on your equipment. You can adjust your pricing for those jobs or change your equipment assignment.
Frequently Asked Questions
Q: Is predictive maintenance
No comments yet
Be the first to share your thoughts.
Leave a Reply
Comments are disabled on the shared-hosting build. If you want to respond to this article, email info@ops-flo.com and mention "Equipment Failure Prevention Oilfield Teams Underinvest In".
Contact OpsFlo