

How To Prevent Equipment Downtime With Predictive Maintenance, Not Guesswork
The hard truth in the oilfield is that your equipment does not break down at random. It breaks down because you ignored the warning signs. Vibration, heat, pressure drops, and fluid contamination all tell you exactly when a triplex pump or top drive will fail. The only question is whether you are listening.
The most direct way to how to prevent equipment downtime with predictive maintenance is to stop treating your maintenance schedule as a calendar event and start treating it as a data problem. This guide shows you the exact operational framework to do that. No vendor fluff. No software fairy tales. Just the arithmetic of keeping your spread running.
The Real Financial Drain Is Not the Repair Bill
Every hour of unplanned downtime in the Permian Basin costs you more than the mechanic's hourly rate. Consider a single workover rig in the Delaware Basin. The rig spread rate runs between $18,000 and $25,000 per day. The service company's margin on that spread is thin, maybe 15 percent before G&A. When that rig goes down for 12 hours because a mud pump liner failed, you do not just lose the repair cost. You lose the entire day's revenue opportunity. You also lose the crew's wages, the hotel rooms, the per diem, and the trucking that is still running.
The industry average for unplanned downtime across drilling and well servicing is between 3 and 5 percent of total operating time. On a $20,000 per day spread, that is $600 to $1,000 per day in pure lost revenue. Over a 30-day month, that is $18,000 to $30,000 disappearing from one rig. If you run ten rigs, that is $300,000 a month. That is $3.6 million a year. And that number does not include the cost of the replacement parts, the emergency freight charges, or the overtime paid to the crew that has to work through the night to get back online.
The Math on One Failure:
- Spread rate: $22,000/day
- Downtime: 14 hours
- Lost revenue: $12,833
- Emergency parts freight: $4,500
- Overtime labor: $3,200
- Total cost of one avoidable failure: $20,533
Why Generic Solutions and Spreadsheets Fail in the Field
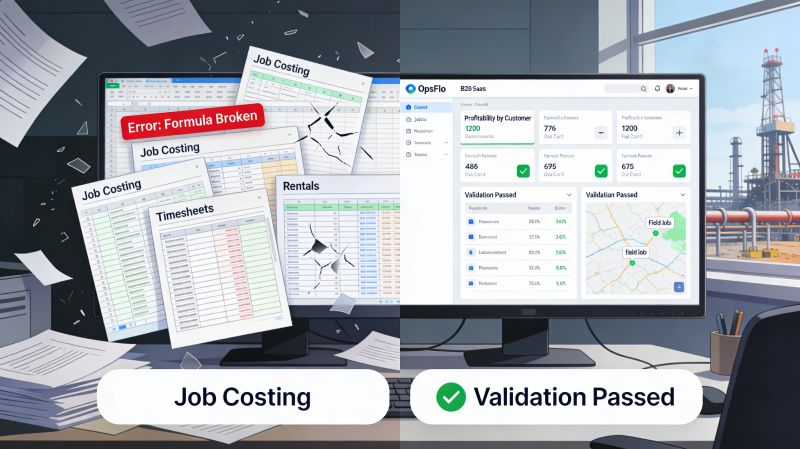
Most operators try to solve this with a spreadsheet. They track engine hours. They track the date of the last oil change. They put a sticky note on the doghouse door that says "change filters at 500 hours." This is not maintenance. This is a calendar with a prayer attached.
The problem is that calendar-based maintenance assumes every piece of equipment operates under identical conditions. That is false. A frac pump running in the Haynesville at 2,500 psi with high sand concentration wears out at a completely different rate than the same pump running a slickwater job in the Midland Basin at 1,800 psi. A wireline unit that sits idle for three days in the Eagle Ford and then runs hard for 18 hours straight has a different failure profile than one that runs steady 12-hour shifts.
Spreadsheets also fail because they rely on manual data entry. The pumper or the operator has to remember to log the vibration reading. He has to remember to write down the temperature of the bearing housing. In the middle of a 14-hour tour, with a company man screaming about the drilling curve, the logbook gets ignored. The data gets faked. The spreadsheet becomes a work of fiction that you use to justify decisions.
The other failure mode is the "run it until it breaks" school of thought. This is common with smaller operators running swab rigs or vacuum trucks. They think they are saving money by not doing preventive maintenance. They are wrong. The cost of a catastrophic failure, like a blown top drive motor or a cracked fluid end, is always five to ten times the cost of the predictive repair. You are not saving money. You are gambling with a loaded die.
The Operational Framework to Prevent Downtime with Predictive Maintenance
To truly understand how to prevent equipment downtime with predictive maintenance, you must change your data collection habits first. The technology is only as good as the data you feed it. Here is the step-by-step framework that works across the Permian, the Bakken, and every basin in between.
Step 1: Instrument the Critical Assets, Not Everything
You do not need a sensor on every valve and fitting. You need sensors on the assets where failure creates the largest financial impact. Start with the top five revenue-generating assets on your location. For a drilling rig, that is the top drive, the mud pumps, and the draw works. For a frac spread, it is the pumps and the blender. For a wireline unit, it is the spooling mechanism and the injector head.
On each asset, you need four baseline measurements. Vibration, temperature, pressure, and fluid condition. These four metrics tell you 90 percent of what you need to know about the health of rotating and reciprocating equipment. A spike in vibration on the main bearing of a triplex pump is the first sign of a failing bearing. A gradual rise in discharge temperature on a top drive motor indicates cooling system degradation. A sudden pressure drop across a filter tells you it is clogging. Fluid analysis showing increasing iron content tells you that metal is wearing away inside the pump.
Step 2: Establish the Baseline and the Alert Thresholds
Once you have the sensors on the equipment, you need to run the asset under normal operating conditions for one week. During that week, you record the normal vibration amplitude, the normal temperature range, and the normal pressure differential. This becomes your baseline.
Then you set two thresholds. The warning threshold is set at 20 percent above the normal baseline. When the asset crosses the warning threshold, the system flags it for inspection at the next natural break in operations, like a trip out of the hole or a rig move. The critical threshold is set at 50 percent above baseline. When the asset crosses the critical threshold, you stop the job and fix it immediately.
This gives you the time to plan the repair. You can order the part ahead of time. You can schedule the maintenance crew to be on location when the part arrives. You can coordinate with the company man to plan the downtime around a natural pause in the drilling or completion program. You turn an emergency into a scheduled event.
Step 3: Close the Loop with Digital Field Ticketing
The sensor data is useless if the repair order and the parts requisition are still on paper. When the warning threshold is crossed, the system must generate a work order. That work order must flow to the dispatcher, the parts room, and the field supervisor simultaneously. This is where most operators fail. They have the sensor data, but the communication is still done over the radio or a text message that gets lost.
You need a system that connects the maintenance alert to the operational workflow. The work order should include the asset ID, the specific sensor reading that triggered the alert, and the recommended action. The parts room should automatically see the required part number and the current inventory level. The dispatcher should see the estimated repair time so he can adjust the schedule for the next job. This is where digital field ticketing becomes your operational backbone. It ensures that the maintenance event is captured, billed, and tracked without anyone having to re-type the data into a separate system.
Step 4: Measure the Mean Time Between Failures
The final step is tracking the metric that matters most: Mean Time Between Failures, or MTBF. This is the average operating time between unplanned failures for a specific asset class. If your MTBF for mud pump fluid ends is 800 hours, and you start doing predictive maintenance based on vibration analysis, you should see that number climb to 1,200 hours within two months.
Every hour of MTBF improvement is an hour of revenue you do not lose. If you increase MTBF by 20 percent across your fleet, you effectively gain 20 percent more available operating time without buying a single new piece of equipment. That is the purest form of profit you will ever find in this business.
Case Study: A Midland Basin Operator Cuts NPT by 40 Percent
Consider a real example from a mid-sized operator running five workover rigs in the Midland Basin. This operator was experiencing an average of 2.5 unplanned downtime events per rig per month. Each event averaged 9 hours. That is 22.5 hours of downtime per rig per month. Across five rigs, that is 112.5 hours of lost spread time every month.
At a blended spread rate of $19,500 per day, or $812.50 per hour, those 112.5 hours represented $91,406 in lost monthly revenue. That is over $1.09 million per year in pure lost revenue from five rigs.
The operator implemented a predictive maintenance program focused on the mud pumps and the top drives. They installed vibration sensors on the pump bearings and temperature sensors on the top drive motors. They set the warning threshold at 20 percent above baseline and the critical threshold at 50 percent above baseline. They connected the alerts to their dispatch system using digital work orders.
In the first 60 days, the system caught three developing bearing failures on the mud pumps. Each failure was caught at the warning stage, meaning the pumps were still running. The operator scheduled the repairs during rig moves, which are natural downtime windows. The repair cost averaged $3,800 per event, including parts and labor. The total cost of those three proactive repairs was $11,400.
Had those failures gone undetected, they would have resulted in catastrophic failures. The historical cost of a catastrophic mud pump failure for this operator was $18,000 in parts, $6,000 in emergency labor, and an average of 16 hours of downtime. The total cost of three catastrophic failures would have been $72,000 in direct costs plus $39,000 in lost revenue. That is $111,000 versus the $11,400 they spent on proactive repairs.
By the end of the first quarter, the operator's unplanned downtime events dropped from 2.5 per rig per month to 1.5 per rig per month. The average duration of each event dropped from 9 hours to 5 hours because the remaining failures were less severe. Total monthly downtime dropped from 112.5 hours to 37.5 hours. That is a 67 percent reduction in lost time. The annualized savings exceeded $730,000 across the five-rig fleet.
The operator also saw a secondary benefit. Because the equipment was healthier, the fuel consumption on the rigs dropped by 4 percent. The pumps were not working against the friction of failing bearings. The top drives were not overheating and losing efficiency. That saved an additional $1,200 per month in diesel across the fleet.
This is the difference between how to prevent equipment downtime with predictive maintenance versus reactive maintenance. The operator spent $11,400 to save $730,000. That is a 64-to-1 return on investment. No other decision you make as an operations executive will deliver that kind of return.
Implementation Checklist for Supervisors and Office Dispatch
You do not need to boil the ocean. You need a practical checklist that your field supervisors and your office dispatch can execute starting Monday morning. Here is the list.
- Identify the top 5 revenue assets in your fleet. List them by spread rate and utilization. The highest spread rate times the highest utilization is your first target.
- Install baseline monitoring on those assets. Start with vibration and temperature. Add pressure sensors if the asset has a hydraulic or fluid system.
- Run one full week of data collection. Do not set thresholds until you have seen the asset operate under normal load. Record the data manually if you do not have automated sensors yet. Something is better than nothing.
- Set warning thresholds at 20 percent above baseline. Set critical thresholds at 50 percent above baseline. Write these numbers down and post them in the doghouse.
- Create a standard work order template. The template must include asset ID, sensor reading, threshold crossed, and recommended action. Use your digital field ticketing system to route this automatically.
- Schedule a weekly maintenance review meeting. Every Friday at 10:00 AM, the dispatcher, the operations manager, and the head mechanic review the week's alerts. Decide which ones get fixed during the next natural downtime window.
- Track MTBF weekly. Post the number in the dispatch office. Celebrate when it goes up. Investigate immediately when it goes down.
- Review your parts inventory for the critical spares. You do not need a full warehouse, but you need the top 20 parts that fail most often. If you have a pump bearing fail at the warning stage, you need that bearing in stock or on a truck within 24 hours.
Frequently Asked Questions
How is predictive maintenance different from preventive maintenance?
Preventive maintenance is time-based. You change the oil every 500 hours because the manual says so. Predictive maintenance is condition-based. You change the oil when the oil analysis shows the additive package is depleted or the viscosity is breaking down. Predictive maintenance catches the failure before it happens. Preventive maintenance just hopes the failure does not happen between service intervals.
Do I need expensive sensors on every piece of equipment?
No. Start with the assets that cost you the most money when they fail. A $200 vibration sensor on a $50,000 mud pump is cheap insurance. A $200 sensor on a $2,000 centrifugal pump is a waste of money. Use the 80/20 rule. Focus on the 20 percent of your assets that generate 80 percent of your revenue.
What if my crews resist the extra data collection?
The crews resist when the data collection is busywork that does not help them. They will not resist when they see that the system catches a failing bearing before it strands them on location for 16 hours. Show them the benefit. Pay a small bonus for accurate data collection. And make the data collection as easy as possible. A mobile app with a dropdown menu is better than a paper logbook. Voice entry is even better.
How quickly will I see a return on investment?
Most operators see a measurable reduction in unplanned downtime within 30 to 60 days of implementing a basic predictive maintenance program. The first few failures are usually caught at the warning stage because the equipment was already degrading. The return on investment is typically positive within the first quarter. Use the ROI calculator to run the numbers on your specific fleet before you start.
The Executive Takeaway
The oilfield rewards operators who keep iron in the ground and turning to the right. Every hour of unplanned downtime is a direct hit to your bottom line, your crew's morale, and your reputation with the operator who is paying the spread rate.
You now know how to prevent equipment downtime with predictive maintenance. The framework is simple. Instrument your critical assets. Establish baselines. Set warning thresholds. Close the loop with digital work orders. Track your MTBF. The hardest part is not the technology. The hardest part is admitting that your current maintenance schedule is guesswork dressed up as a process.
Stop guessing. Start measuring. The data is already there, in the vibration of the bearing, in the heat of the motor, in the pressure drop across the filter. You just have to listen.
If your equipment keeps failing despite your best efforts, read the detailed breakdown of the root causes at why your equipment keeps breaking down. Then request a revenue diagnostic to see exactly how much downtime is costing your operation and where to start your predictive maintenance program.
No comments yet
Be the first to share your thoughts.
Leave a Reply
Comments are disabled on the shared-hosting build. If you want to respond to this article, email info@ops-flo.com and mention "How To Prevent Equipment Downtime With Predictive Maintenance, Not Guesswork".
Contact OpsFlo